August 31, 2026
How to Track Your Net Worth with a Simple Workflow
Learn how to track your net worth with a simple, repeatable workflow. Covers listing assets and liabilities, monthly cadence, and historical charts.
net worthtrack net worthpersonal financebudget appbalance sheet

If your income looks solid but the question still nags at you, the problem usually isn't earnings. It's that the money is spread across checking, savings, retirement accounts, a mortgage, maybe a car loan, and a home value that changes when you're not looking. How to track your net worth starts with admitting that you don't need a perfect number, you need a repeatable way to see whether the household balance sheet is moving in the right direction.
Net worth is a single subtraction, everything you own minus everything you owe. That simple definition is also how major statistical systems treat it, with the OECD defining household total net worth as assets minus liabilities and the U.S. Federal Reserve publishing household and nonprofit net worth as a national balance-sheet series, including a recent reading of about $183.0 trillion in Q1 2026 and a net worth-to-disposable-personal-income ratio of 7.81 (OECD household net worth, Federal Reserve recent developments). Those macro numbers matter because they reinforce the point, net worth is a balance-sheet measure, not a mood.
The value is in the trajectory, not a one-time snapshot. A household can save steadily, pay down debt, and still feel stuck if it only watches cash flow. Net worth captures equity building, investment compounding, and debt reduction in one place.
Practical rule: If a number changes but you can't explain why, the workflow needs work, not more tabs.
A clean process beats a heroic spreadsheet. The rest of this method is built around a consistent snapshot date, a simple balance-sheet log, and a confidence band for the assets that refuse to behave like checking accounts.
Table of Contents
- What Net Worth Means and Why Tracking It Helps
- Building Your Personal Balance Sheet From Scratch
- Picking a Cadence and Recording Changes the Right Way
- Using a Money View and CSV Export for Historical Tracking
- Handling Hard-to-Value Assets Without Fooling Yourself
- A Simple First-Month Checklist to Get Started
What Net Worth Means and Why Tracking It Helps
A household can watch its paycheck rise each year and still wonder whether it is getting ahead. That question is the right one. Income can improve while debt, asset values, or spending habits move the other way, and monthly cash flow will not show the full picture.
Net worth is the household balance sheet in plain English. Add up assets, cash, savings, brokerage accounts, retirement accounts, home value, vehicles, and anything else you own, then subtract liabilities like mortgages, student loans, credit cards, and auto loans. As noted earlier, major statistical systems treat net worth the same way at the macro level, as assets minus liabilities.
Why the subtraction beats a spending-only view
Spending data shows where money went. Net worth shows what remained after the movement settled. That makes it more useful for long-term progress, especially when you are building equity, paying down principal, or holding investments that compound outside a monthly budget.
As noted earlier, household net worth is also tracked at scale by the OECD, which is another reminder that this is a measurement problem, not a transaction problem. You are not trying to count every dollar twice. You are trying to see whether the balance sheet is improving.
The number itself is only part of the job. The harder part is the trajectory across months and years. A household that updates inconsistently ends up arguing with memory. A household that uses the same method every month can see whether debt shrank, investments grew, or a home value change was just noise.
That is why I treat net worth tracking as a workflow problem. A short, repeatable process works better than a perfect spreadsheet no one opens. Use one calendar date, the same asset and liability lines each time, and a way to separate real progress from valuation drift. Hard-to-value assets need a confidence band, not false precision. A home or pension can move your net worth materially, but its exact value is often a range, and that range is what keeps the comparison honest from month to month.
The habit changes behavior. The perfect formula mostly changes how long you stare at the sheet.
Building Your Personal Balance Sheet From Scratch
Start with a list, not a dashboard. The first version is a personal balance sheet with every account and liability on one page, grouped in the way a household thinks about money. Keep it plain. Plain is what makes it usable next month.
A practical setup splits the page into two sides, assets on one side, debts on the other. On the asset side, list cash, checking, savings, brokerage, retirement accounts, home value, vehicles, and any other holdings you would count. On the liability side, list mortgage balance, student loans, credit cards, auto loans, and other debts. For debts, use the current payoff balance, not the original loan principal. That matches the balance-sheet method used in tracking workflows, as discussed in the introduction and in Tiller workflow guidance.
Use the same source for each number each month. Logged-in balances and account statements are better than mental math because they can be checked later. If your checking balance comes from the bank app, your savings balance should come from the bank app too. Consistency matters more than elegance.
Practical rule: Transfers between your own accounts are not spending. Moving money from checking to savings changes the label, not the net worth.
A contribution into a brokerage account is also just a shift from one asset to another if the cash already belonged to you. Employer matches, vested pensions, and crypto holdings belong on the asset side once they are yours. Joint accounts should be recorded at their full balance so both partners see the same household picture, not a split version that hides the exposure.
| Category | Examples | Where to Get the Number |
|---|---|---|
| Cash and checking | Everyday spending accounts | Bank app or statement balance |
| Savings | Emergency fund, sinking funds | Logged-in balance on update day |
| Investments | Brokerage, retirement accounts | Platform total or statement |
| Real estate | Primary home, rental property | Current valuation method |
| Vehicles | Car, truck, motorcycle | Resale estimate you'll reuse consistently |
| Debts | Mortgage, student loan, card balances | Current payoff balance |
| Other assets | Valuable collectibles, business stake | The most recent defensible value |
If you also track credit card repayments separately, keep that logic aligned with your balance sheet. This credit card payment tracking guide fits neatly into the same habit of reconciling balances instead of guessing.
The first pass takes the longest because you are building the inventory. After that, each month is mostly a quick update.
Picking a Cadence and Recording Changes the Right Way
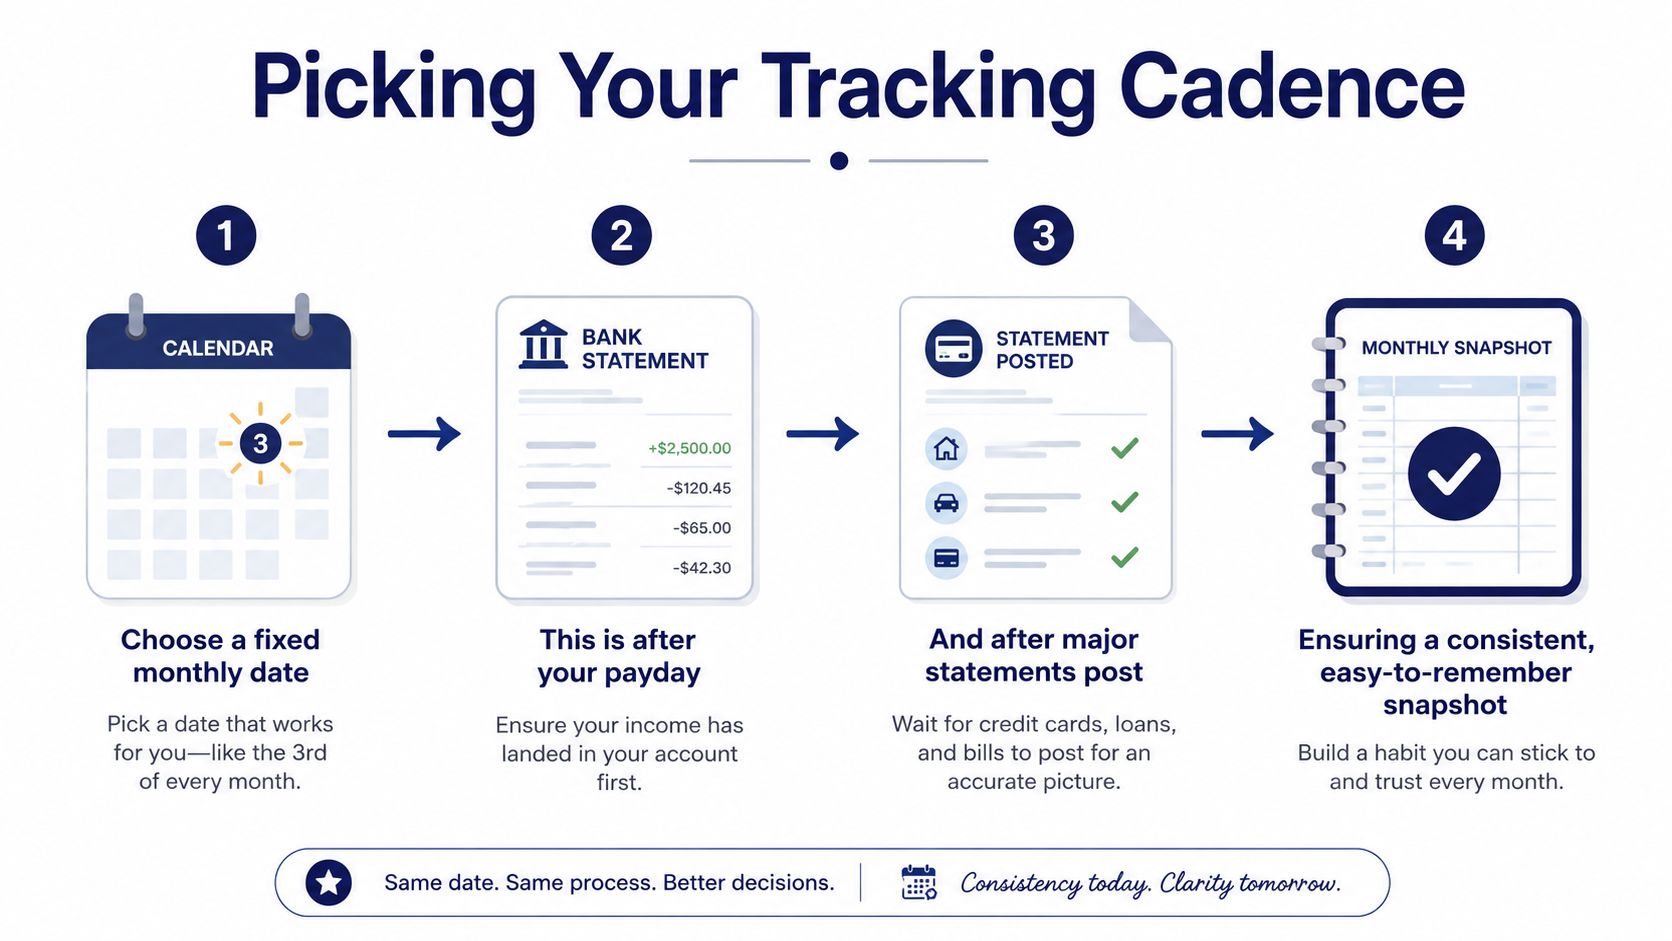
A monthly net worth check works best on the same calendar date each time. Pick a day one to three days after payday and after major statements post, then keep it fixed. If one month's snapshot lands before income clears and the next lands after, the comparison stops meaning much.
The workflow should separate valuation drift from cash contributions. Valuation drift is the change in home value, investment prices, or other market-driven assets. Cash contributions are the actions you control, deposits, debt paydowns, transfers into investments, and extra principal payments. If you lump them together, a strong month can look like discipline when it was really the market, and steady saving can get buried under short-term noise.
Record the reason, not just the number
When a balance changes, log two fields, amount and reason. “Brokerage up” is too vague. “Monthly contribution,” “market move,” “card payoff,” and “home valuation update” tell you what kind of change happened, which matters when you review the trend later.
A note column solves a problem that numbers alone cannot. It lets you see whether a change came from your habits or from an outside move in the asset itself. It also makes year-over-year comparisons easier, because recurring items stand out, like an annual tax bill, an insurance adjustment, or a seasonal savings push.
Use live numbers sparingly. Daily checking creates more noise than insight for most households, especially when markets move or a home estimate shifts between updates.
For harder-to-price items, a slower review is enough. Check real estate, vehicle values, and private investments on a quarterly mini-audit, then keep the monthly cadence for liquid accounts. That keeps the record usable without pretending every asset can be priced with the same confidence.
A purpose-built tracker like the one described in our net-worth-tracking-app guide keeps this cadence simple. The point is not more updates. The point is a history you can trust, including a clear sense of which numbers are solid and which ones sit inside a confidence band.
Using a Money View and CSV Export for Historical Tracking
A dedicated Money view works better than trying to force every account into a live-linked aggregator. Manual entry keeps the record auditable, and for net worth tracking that matters more than automated freshness. You want a clean history you can inspect later, not a stream of balances that changes under your feet.
One practical setup is a Money view where each balance-sheet line becomes a row with a manual balance field and a date stamp. In Ledgerly, that means you can keep checking, savings, brokerage, credit cards, mortgage, and loans visible in one place, while transfers between accounts are handled as moves rather than expenses. It also fits the app's on-device, manual-entry design, which is useful when you care about privacy and explicit control.
On update day, open the view, type in the current balances, and save the snapshot. The monthly habit stays the same whether you're entering five lines or fifteen, because the process doesn't change. If you want the history elsewhere, export the snapshot to CSV and each saved period becomes a row you can chart in a spreadsheet or another analysis tool.

The value of CSV export is that it gives you an append-only history. That's the part people underestimate. Once the snapshot is saved, you're not overwriting the past to make the current month look cleaner. You're preserving the record exactly as it was on that date, which makes trend analysis and personal review much more reliable.
If you prefer a spreadsheet-first workflow, the same logic applies, but the Money view reduces friction by keeping the monthly input list visible in one place. This spreadsheet-oriented guide is useful if you want to mirror the same method outside an app.
The target isn't live data. The target is a record you can trust six months later when you want to know whether your balance sheet improved.
Handling Hard-to-Value Assets Without Fooling Yourself
Homes, pensions, and private business stakes are the places where net worth tracking gets slippery. A checking account has a real balance. A house, not so much. If you pretend every illiquid asset has a single precise monthly value, you'll end up with a chart that looks authoritative and isn't.
The fix is a confidence band. For hard-to-price assets, record a low estimate, a mid estimate, and a high estimate, then treat the spread as meaningful information instead of bookkeeping noise. The range is the point, because it tells you how much uncertainty sits inside the number.
Use a range when precision is fake
A house can move enough in value to dominate the rest of the household balance sheet. A pension statement can lag reality. A private holding can be even harder to price because there may not be a public market at all. If a single value can swing materially from one month to the next, a shaded range tells a truer story than a thin line pretending to be exact.
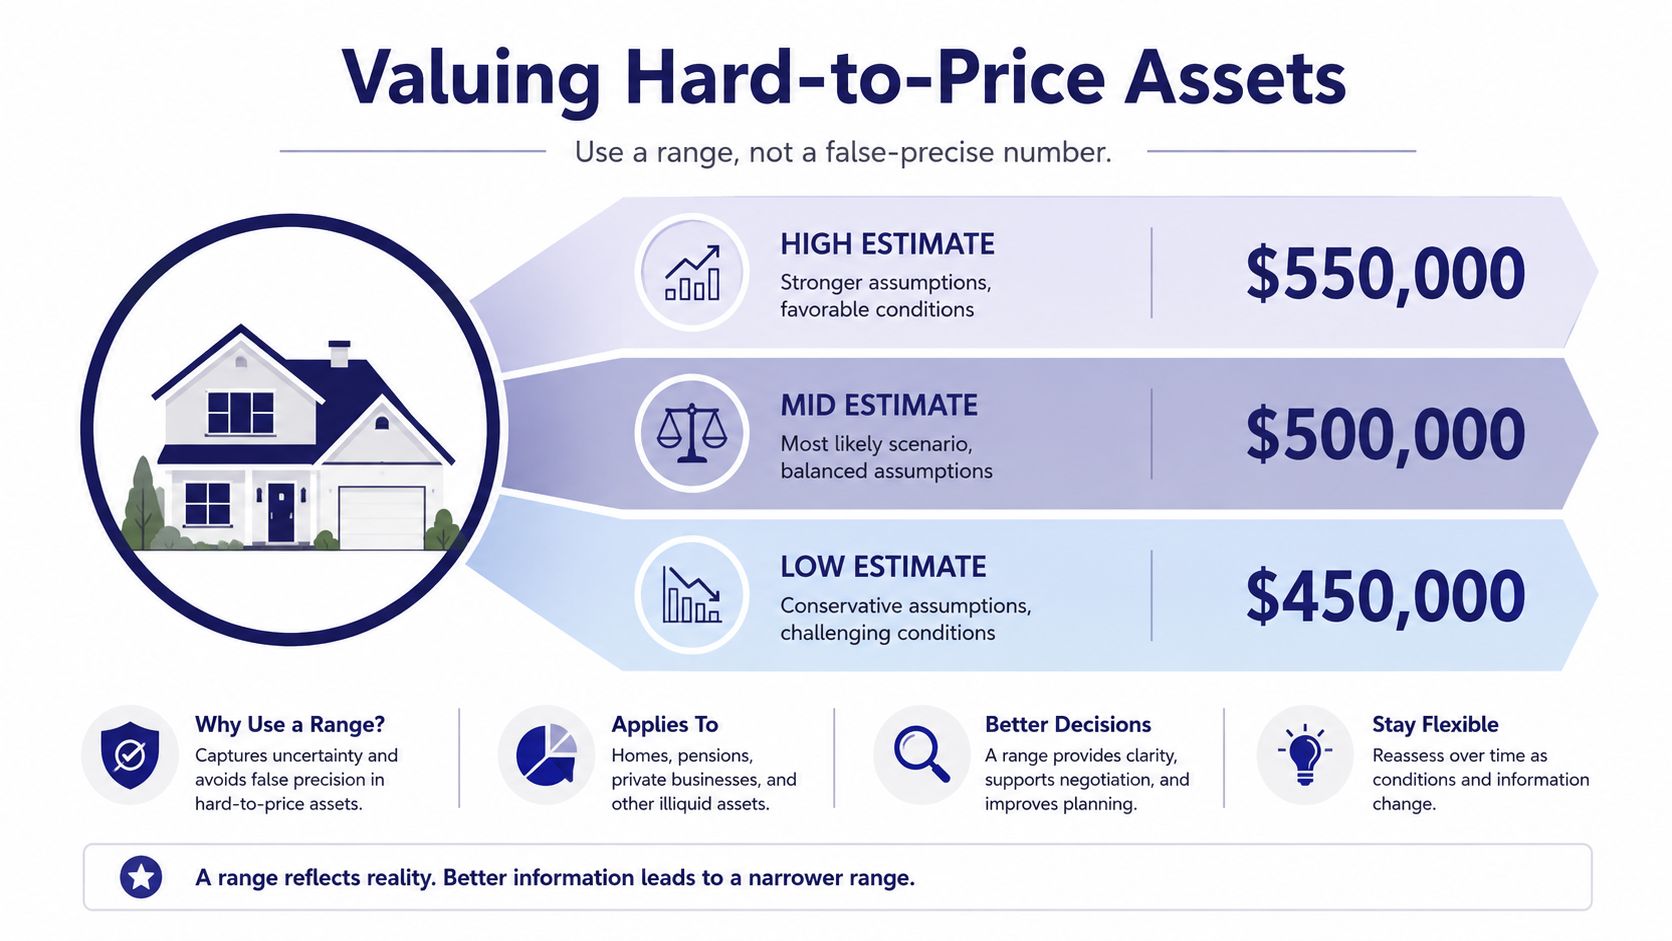
Use a recent comparable or a home estimate tool on a quarterly rhythm for real estate, the plan statement for pensions, and the most recent valuation you can defend for private holdings. Keep the values in separate fields so the historical chart can show a band instead of a single misleading line. That way, you can see when the trend is real and when it's just valuation drift.
Rule of thumb: If the value feels too precise to be true, it probably is.
This approach makes monthly tracking calmer, not more complicated. You still get a headline net worth number for momentum, but you also get a practical note about where the estimate is fuzzy. That's enough to stop overreacting to a one-month jump or dip in an illiquid asset.
The goal is not to eliminate uncertainty. The goal is to know where it lives so it doesn't distort the rest of the picture.
A Simple First-Month Checklist to Get Started
You don't need a weekend project to start. One evening is enough if you keep the first pass narrow and practical. The important thing is to finish with a usable baseline, not a polished system.
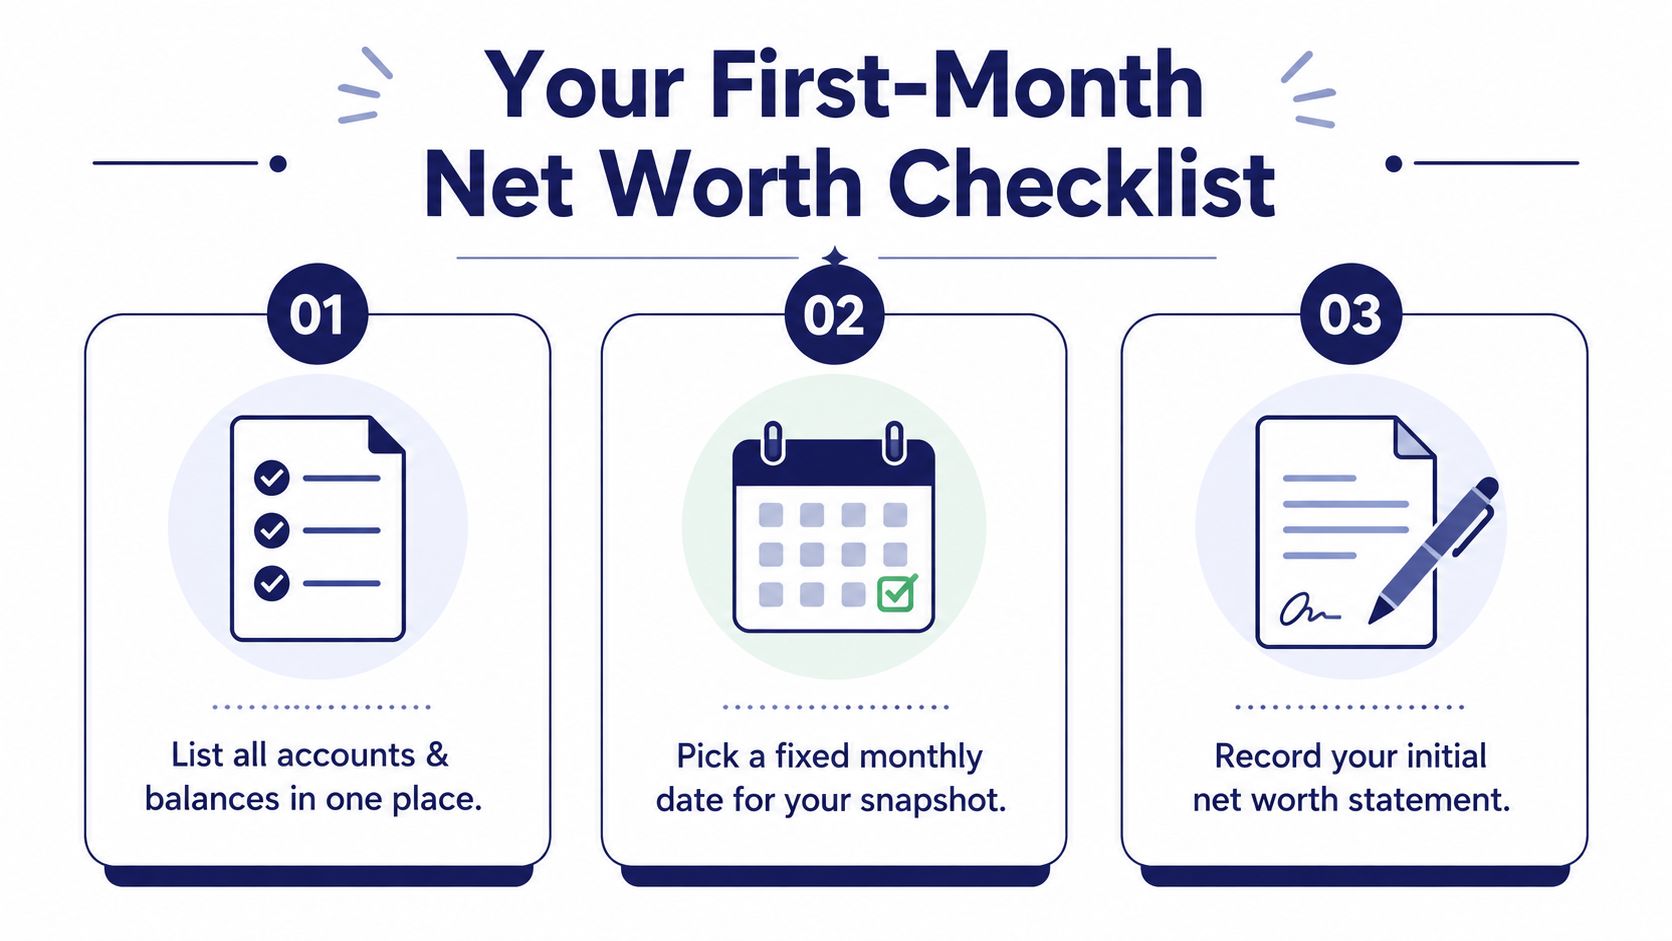
- List every account and balance in one place. Pull together cash, checking, savings, investments, debts, and any major assets you want to count.
- Pick a fixed monthly date. Use the same day every month so the snapshots are comparable.
- Create a simple Money view or spreadsheet row for each line. One row per account keeps the review fast and visible.
- Enter the values and save the first snapshot. That creates your starting point, even if the numbers feel incomplete.
- Export the CSV or chart the total. Two points next month will already tell you more than memory does.
- Repeat the process without changing the rules. Consistency is what turns a note into a trend.
The first real win usually isn't the first snapshot. It's the third one, when the chart starts to show a line that reflects decisions instead of guesswork. At that point, you can see whether savings habits, debt paydowns, and valuation changes are moving the household balance sheet in the direction you want.
If you want a simple place to keep the workflow organized, Ledgerly lets you enter balances manually, keep transfers separate from spending, and export the record when you want a historical view. It's a practical fit if you'd rather maintain a private monthly balance sheet than depend on bank syncing or auto-imported data.